
Usage, limits and cost
How to Check Your Claude Code Token Usage (and Plan Limits)
How to check Claude Code token usage: /usage, /context, the status line, local session logs, the Console and usage tools, and why their numbers differ.
On this page
- Every way to check, compared
- Check usage inside Claude Code with /usage
- See what fills the context window with /context
- Keep token usage on screen with the status line
- Read token counts from Claude Code's session logs
- Check usage on an API key, Team or Enterprise
- Usage tools that read the logs for you
- Why the numbers don't match
- FAQ
To check your Claude Code token usage, run /usage inside a session (/cost and /stats open the same screen). It shows the current session's input, output and cache tokens by model, plus, on Pro and Max, how much of your 5-hour and weekly limits you've used. For what's filling the context window right now, run /context; to watch usage continuously, add it to your status line; and for history across sessions, read the logs Claude Code keeps in ~/.claude/projects.
Everything here was checked against the Claude Code cost docs, the commands reference and the status line docs on October 3, 2026.
Every way to check, compared
| Method | What it shows | Covers | Best for |
|---|---|---|---|
| Eddie (Mac notch app) | Tokens and API-equivalent cost per session, project and day | Every Claude Code session on this Mac | Seeing all sessions at a glance; cost tracking is on a Mac |
/usage | Session tokens by model, estimated cost, plan bars, usage breakdown | This machine's sessions | A quick check from inside a session |
/context | What's in the context window right now, as a grid | The current session | Finding what makes each request big |
| Status line | Any field you choose, after every response | The current session | Keeping one number always visible |
Session logs (~/.claude/projects) | Raw token counts for every API response | This machine, last 30 days by default | Your own scripts and reports |
| Settings > Usage on claude.ai | Plan limits and usage credits | All devices and claude.ai | The authoritative view on Pro and Max |
| Claude Console | Billed API usage and spend | Your API organization | The authoritative view on an API key |
| OpenTelemetry | claude_code.token.usage and claude_code.cost.usage metrics | Every machine you configure | Teams with an observability stack |
The rest of this guide goes through each one.
Check usage inside Claude Code with /usage
/usage opens on top of your session without interrupting a running response. The Session block at the top looks like this example from the docs:
Total cost:            $0.55
Total duration (API):  6m 20s
Total duration (wall): 6h 33m 10s
Total code changes:    0 lines added, 0 lines removed
Usage by model:
   claude-sonnet-4-6:  1.2k input, 5.3k output, 940.0k cache read, 50.0k cache write ($0.55)
Read it like this:
- Input is fresh, uncached input. It's usually tiny, because almost everything is served from the prompt cache.
- Cache read is the conversation Claude Code resends with each request and the API reads from cache. In a long session it dwarfs everything else.
- Cache write is new content being stored in the cache, such as a file Claude just read.
- Output includes thinking tokens, which are billed as output.
- Total cost is computed locally at list price. On an API key it approximates your bill; on Pro and Max the docs say it "isn't relevant for billing purposes." Our guide to API value versus what you pay explains the difference.
These totals reset when /clear starts a new session (from v2.1.211). A Prompt cache (main) line (v2.1.251 or later) shows how much input came from cache and how many requests missed it.
The plan usage breakdown
On Pro, Max, Team and Enterprise, /usage also shows plan usage bars and a breakdown of what counted against your limits: shares for skills, subagents, plugins and individual MCP servers, flags for behaviors such as long context or cache misses once one passes 10% of recent usage, and your heaviest /loop and scheduled tasks. Press d or w to switch between the last 24 hours and the last 7 days.
Two caveats from the docs: the figures are approximate, and they're computed from local session history on this machine, so usage from other computers or claude.ai isn't included. Your plan bars are fetched from Anthropic, so they do include everything.
See what fills the context window with /context
/usage tells you how much; /context tells you why. According to the commands reference, it draws the current context as a colored grid with a per-item breakdown, and suggests fixes for context-heavy tools, memory bloat and capacity problems. Pass all to expand the breakdown. If the conversation has grown past the context window, it also says how far over you are and which command frees space.
This matters because context is what you pay for again on every request. Whatever sits in it permanently, such as a long CLAUDE.md or MCP servers you never use, gets resent with each message, so trimming it saves tokens all day. Our list of ways to reduce Claude Code token usage covers what to trim.
Keep token usage on screen with the status line
The status line is a script Claude Code runs after each response, with session data as JSON on stdin. The token fields you can use:
| Field | Meaning |
|---|---|
context_window.used_percentage | How full the context window is, from input tokens only |
context_window.total_input_tokens | Input in the context from the latest response, including cache reads and writes |
context_window.current_usage | That latest response split into input_tokens, output_tokens, cache_creation_input_tokens, cache_read_input_tokens |
cost.total_cost_usd | Estimated session cost at list price |
rate_limits.five_hour.used_percentage | Pro and Max: share of the 5-hour limit used |
rate_limits.seven_day.used_percentage | Pro and Max: share of the weekly limit used |
prompt_cache.hit_ratio | Share of input served from cache this session |
Note that the context_window numbers describe the current context, not a running total. For the session total, use cost.total_cost_usd or /usage.
A one-line setup that shows the model, context use and session cost, using jq:
{
  "statusLine": {
    "type": "command",
    "command": "jq -r '\"[\\(.model.display_name)] ctx \\(.context_window.used_percentage // 0 | floor)% · $\\(.cost.total_cost_usd // 0 | . * 100 | round / 100)\"'"
  }
}
The status line itself runs locally and doesn't consume API tokens. Our status line guide has eight complete scripts, including one for plan limits.
Read token counts from Claude Code's session logs
Claude Code writes every conversation to a JSONL transcript at ~/.claude/projects/<project>/<session>.jsonl, as the .claude directory docs describe. Subagent transcripts live next to it in <session>/subagents/. By default these files are deleted after 30 days (the cleanupPeriodDays setting).
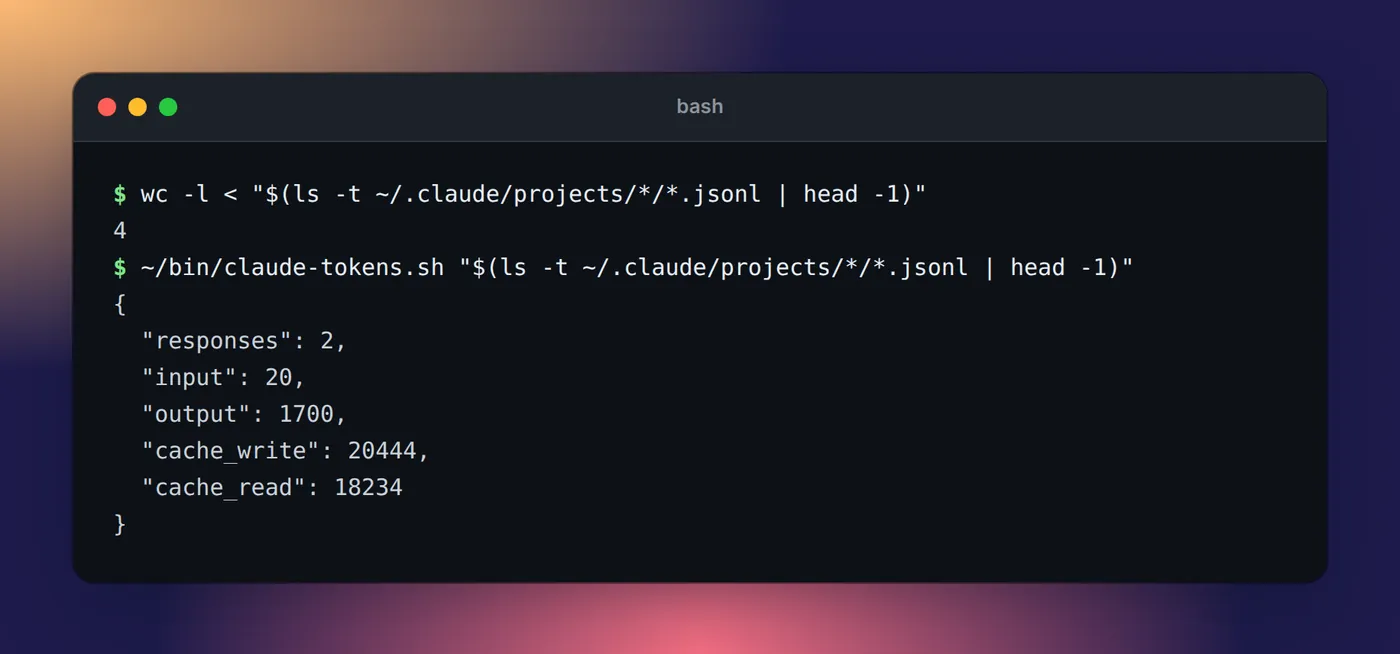
Each assistant line carries the API's usage object for that response: input_tokens, output_tokens, cache_creation_input_tokens and cache_read_input_tokens. One trap: a single response can be written as several lines that share the same message.id and the same usage, so adding up every line overcounts. This script counts each response once:
#!/bin/bash
# Sum the tokens in one Claude Code transcript, counting each API response once
jq -s '
  [ .[] | select(.type == "assistant" and .message.usage != null) ]
  | unique_by(.message.id)
  | map(.message.usage)
  | {
      responses: length,
      input: (map(.input_tokens // 0) | add),
      output: (map(.output_tokens // 0) | add),
      cache_write: (map(.cache_creation_input_tokens // 0) | add),
      cache_read: (map(.cache_read_input_tokens // 0) | add)
    }' "$1"
Run it on the newest transcript of a project with ~/bin/claude-tokens.sh "$(ls -t ~/.claude/projects/*/*.jsonl | head -1)". The transcript format is not a documented API, so treat scripts like this as something that may need fixing after an update. The status line passes transcript_path if you want to point a script at the current session.
Check usage on an API key, Team or Enterprise
If Claude Code bills to an API organization, the Claude Console usage page is the authoritative number. The first time you sign in with a Console account, a "Claude Code" workspace is created to track Claude Code spend separately, and the Console's Claude Code dashboard shows spend and accepted lines per member.
On Team and Enterprise, admins see a spend report in org analytics (with CSV export, updated daily) and adoption data at claude.ai/analytics/claude-code. The costs docs map each setup to where you see and cap spend.
For anything more custom, Claude Code exports OpenTelemetry metrics. Set CLAUDE_CODE_ENABLE_TELEMETRY=1 and an exporter, and you get claude_code.token.usage (split by type: input, output, cacheRead, cacheCreation) and claude_code.cost.usage, per user and model. To try it locally:
export CLAUDE_CODE_ENABLE_TELEMETRY=1
export OTEL_METRICS_EXPORTER=console
export OTEL_METRIC_EXPORT_INTERVAL=1000
claude
Usage tools that read the logs for you
If you'd rather not write scripts, a few tools read the same local logs.
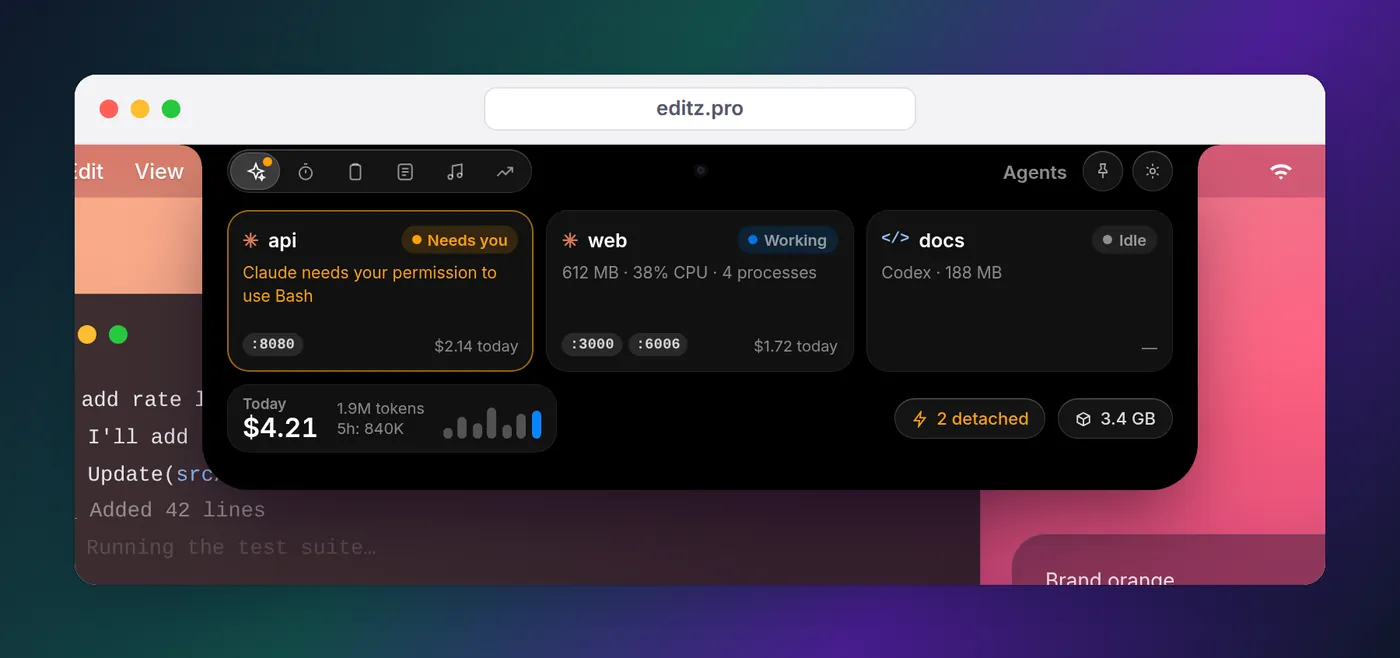
Eddie is our notch app for Mac and Windows. On a Mac it sits in the MacBook notch (or a drawn notch on Macs without one) and shows each Claude Code session's tokens and API-equivalent spend, plus totals per project and per day, with no API key and nothing uploaded. It also shows whether each session is working or waiting for you, which is why it's in the notch rather than in a report. Its limits: cost tracking is a Mac feature (Eddie for Windows shows session status, not cost), cost is shown at list price rather than as your plan's remaining percentage, and it doesn't cover usage from claude.ai or other computers. The notch guide shows how it works.
Choose ccusage if you want detailed tables in the terminal on any OS. Per its README, npx ccusage@latest prints daily, weekly, monthly and per-session reports from local data, with a blocks report for 5-hour windows and JSON output, and it reads logs from Codex, Gemini CLI and other agents too.
Why the numbers don't match
You'll often see different totals in different places. That's expected:
- Local versus account-wide.
/usagebreakdowns, session logs, Eddie andccusagesee only this machine. Your plan bars and the Console see everything. - Estimates versus bills. Every local dollar figure is computed from token counts at list price, unless your organization set a
modelPricingtable. Only the Console or your invoice is billing. - Context versus totals. The status line's
context_windowfields describe the latest request;/usageandcost.total_cost_usdadd up the whole session. /contextversus the status line./contextadds an estimate for messages added since the last response, so it can read higher until the next response arrives.- Cleared sessions.
/clearstarts a new session, so the session totals start again at zero.
If a number looks wrong, check which of these you're comparing before assuming a bug. For limits specifically, our guide to the 5-hour limit explains how the plan bars work.
FAQ
How do I check my Claude Code usage limits?
Run /usage in Claude Code. On Pro and Max it shows bars for the 5-hour session limit and the weekly limit with their reset times. You can also open Settings > Usage on claude.ai, or put rate_limits.five_hour.used_percentage in your status line.
Is there a Claude Code usage dashboard?
For API users, the Claude Console has a usage page and a Claude Code dashboard with spend per member. Team and Enterprise admins get analytics at claude.ai/analytics/claude-code. For individuals on Pro and Max, Settings > Usage on claude.ai is the closest thing, and local tools can build a dashboard from Claude Code's session logs.
Is there a Claude Code usage monitor for Mac?
Yes. Eddie shows tokens and API-equivalent cost per session, project and day in the MacBook notch, read from Claude Code's local logs. Cost tracking is in the Mac app, and it shows list-price equivalents, not your plan's remaining percentage.
How many tokens does a Claude Code session use?
There's no typical number: it depends on how long the session runs, how many files Claude reads and the model. Most of the volume is usually cache reads, because each request resends the conversation. Run /usage to see the split for your own session.
Does checking usage cost tokens?
The status line runs locally and uses no API tokens. /usage can make a small request to fetch your plan's status, and Anthropic counts it among background work that typically costs under $0.04 per session in total.